SAS Access Required.
Email UniversityAnalytics@uta.edu for access. VPN Required Off-Campus.
Enrollment Insights
 This dashboard provides concise overview of enrollment data for new freshmen, transfer, and graduate students. It offers weekly and daily comparisons of registration, funnel, orientation, and housing data with the previous year's data.
Daily Registration
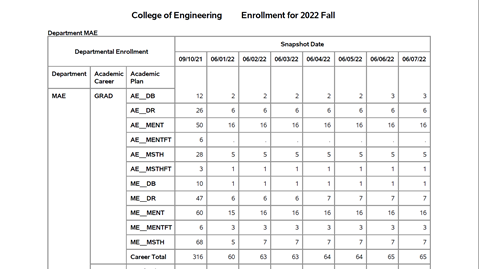
 This dashboard is composed of several reports that provide daily registration totals leading up to census date. Comparison of registration and SCH to same day in previous year is available by college, department, career, cohort entry status, AP status, CB reported flag, gender, ethnicity/race, and student load.
Performance Metrics
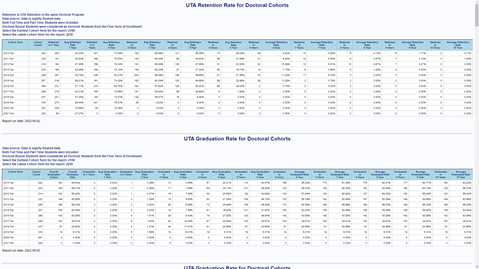
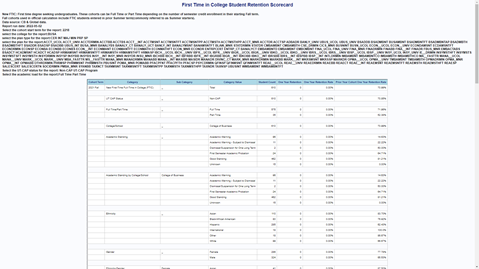
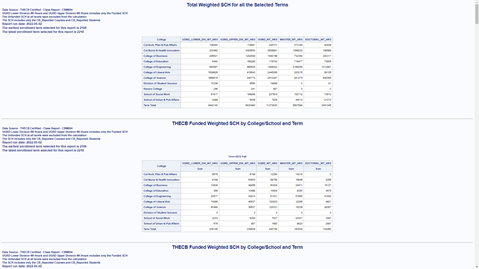
 This dashboard is composed of several official reports that provide information on official THECB metrics. Fall enrollment, SCH, completions, FTIC and new transfer retention and graduation rates are available by college, department, student load, class level, AP flag, gender, race/ethnicity, first generation status, Pell status, age band. Completions can also be filtered by STEM/Non-STEM, doctoral degree category, degree type, degree level. Enrollment and SCH are available in two views for comparison: THECB (census) and Global (end of term). Student success metrics provide a comprehensive view from an equity perspective with line charts showing year over year change for each demographic group.
Admissions Pipeline
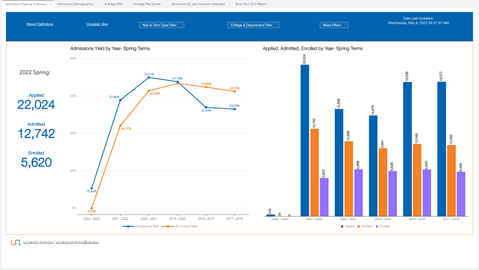
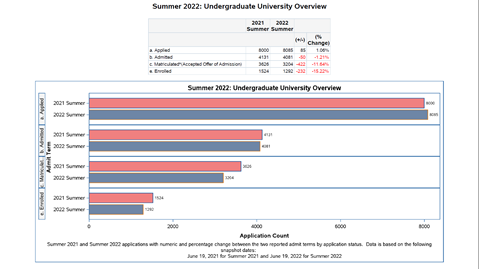
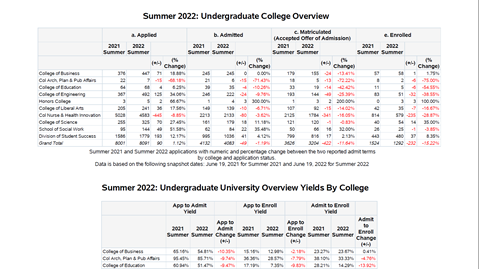
This dashboard is composed of several reports that provide admission related information on students who applied, were admitted or enrolled at UT Arlington. Acceptance and enrollment rates, admission yields, student demographics, average GPA, average test scores, top 25 last school/institution attended are provided with many parameters available for selection to create your own.
Enrollment
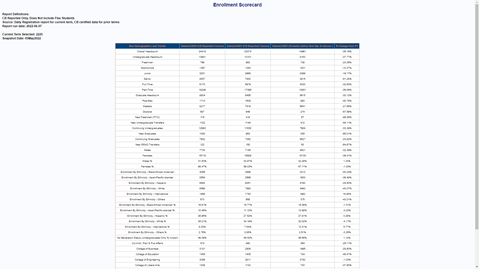
 This dashboard is composed of several reports that provide information related to enrollment and SCH at UT Arlington. Enrollment headcount, SCH total and full-time equivalent measures are available by for multi-year selection, Fall, Spring, Summer, college, department, program, gender, ethnicity/race, age band, tuition residency, adjusted tuition residency, student load, aid type received, online status, AP status, student classification, and career. Single or multiple parameters can be selected to create your own enrollment report.
FTIC Dashboard
 This dashboard is composed of several reports that provide Global enrollment and retention information on FTIC cohorts. Fall to Fall and Fall to Spring 1, and 2-year retention rates and enrollment stats are available by various demographics including gender, ethnicity/race, first generation status, veteran status, first enrollment month, first semester courses and grades, major and major changes, Pell, loan and scholarship status, developmental English and Math course grades, extracurricular activity participation, FYR indicator, Civitas weekly persistence scores etc.
This report should only be used internally as the cohorts may be slightly different than official cohorts.
FTIC Dual Credit
 This dashboard is composed of several reports that provide information on FTIC cohorts who transferred dual credit hours. Enrollment headcount, retention, and graduation rates are available by top 5 high schools, dual credit hours, ethnicity, gender, age band, first generation, Pell and veteran status. Student success measures include academic standing and cumulative GPA for first semester and second semester at UTA. Line charts provide a comprehensive view from an equity perspective and provide a comparison between those started with dual credit hours and the ones without dual credit hours.
This report should only be used internally as the cohorts may be slightly different than official cohorts.
FTIC and New Transfer Persistence Prediction Trends
 This dashboard is composed of two reports that provide a year-over-year weekly trend line predicting persistence into the next long semester. Cohorts include new first time in college degree seeking students (FTIC) and new undergraduate transfer students. Multiple cohort years can be selected and filtered by college, department, ethnicity/race, gender, and student load to build your own trend line graph and crosstab report.
Course Performance Dashboard
 This dashboard provides course success metrics: 4-week grades, midterm grades, final grades, and other insights. Student type, college/school, department, course subject and number, student demographics, and student academics related filters are available for selection.
Course Demand Forecasting
 This dashboard is composed of two reports which are intended to help with seat planning and resource allocation, with a focus on UTA's undergraduate core courses. The first report provides estimates of how many students intend to take each core course in the upcoming long semester (including those who are currently registered or waitlisted, and those who have not yet registered or been waitlisted). These estimates are based on registration data from the preceding long semester. The second report provides enrollment counts, waitlist counts, and total capacities for previous, current, and upcoming offerings of all courses in the UTA course catalog.
Major Migrations
 This dashboard provides several analyses of how students change majors: when they change majors, what majors they change from and to, and how these changes relate to measures of 4-year graduation, 6-year graduation, 1-year retention, and 2-year retention.
Student Debt
 This dashboard tracks how graduate debt is changing. See trends in average debt, percent of graduates with debt, and debt breakdown by program and college. Explore how debt burden varies by gender and ethnicity.
Rankings Dashboard
 This dashboard displays UTA's current position in key national and global rankings that the university actively monitors and participates in. The Trends page provides a historical view of UTA's outcomes in a selected national or international ranking, along with descriptions of the fundamental ranking criteria.
HR Positions & Salaries Report
 This dashboard is composed of several HR reports that provide information on faculty, staff, and student employees. Employee headcount, full time equivalent (FTE), total salary allocation and expense per FTE statistics are available by unit, employee classification, full time vs part time status, and position. Average salary statistics are available by ethnicity/race, gender, age group, years of service and veteran status. Multiple parameters are available for selection to create your own employee list report or to build your own statistics.
HR Faculty & Staff Demographics
 This dashboard is composed of several reports that provide information on current faculty and staff demographics and trends over time. Cross tabular view and charts are available and can be customized for selected parameters such as college, department, tenure status, non tenure, full time and part time to create your own report. Demographic variables include age, gender, ethnicity/race and years of service.